
25 Jun Analyzing the Link Between COVID-19 and Crowded Housing in California

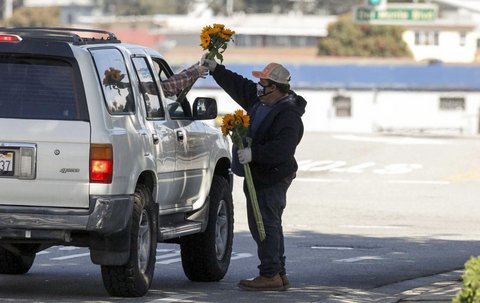
Isidoro Flores Contreras shares a two-bedroom apartment with three other people. He says they would have no way to isolate if one of them got sick. (Vernon McKnight / The Salinas Californian)
This is the final installment in the Close Quarters series. Read Part 1 | Read Part 2
By Jackie Botts, CalMatters
When coronavirus began spreading in California, public health officials told people who fell ill to isolate themselves in their homes for two weeks. But many California families simply can’t do that.
Forced by the high cost of living, parents squeeze into rooms with their children, cousins sleep on couches, grandparents convert living rooms into bedrooms and farmworkers pile into barracks-style bunk beds.
Our CalMatters team, as part of the California Divide, a statewide media collaboration, decided to investigate how these overcrowded homes may be exacerbating the pandemic’s toll on California’s hard-hit communities.
In New York City, an April analysis by New York University epidemiologist Justin Feldman found links between COVID-19 and overcrowded ZIP codes. Neighborhoods with more residential crowding, clustered in the Bronx and Queens, had bigger surges in flu-like emergency room visits this March compared with previous years than less-crowded neighborhoods. So did neighborhoods with more immigrants, fewer white people and more poverty.
Poverty and overcrowding converge in the same neighborhoods. It’s a painful reflection of how a long history of discriminatory policies have segregated neighborhoods across the country.
To replicate Feldman’s analysis across California, we requested the number of positive coronavirus cases in each ZIP code for 14 California counties with the highest case counts in late May. Ultimately, we analyzed data from 10 counties that gave us the data or posted it on their websites: Los Angeles, Riverside, San Diego, Orange, Alameda, Santa Clara, San Francisco, Kern, Tulare and Sacramento. Four counties — San Mateo, Santa Barbara, San Bernardino and Contra Costa — did not make the data available.
For nine of the counties, the data represent cases by May 25, May 26 or May 27. Tulare County’s data came from May 19. (Los Angeles County uses Countywide Statistical Areas, rather than ZIP code.)
To compare the toll across neighborhoods, we calculated number of infected people for every 1,000 residents in each one. In very small neighborhoods, just a handful of cases — say four in one senior home — can look like an extreme outbreak. So our analysis excludes neighborhoods that both had fewer than 2,500 residents and fewer than five infections. (Note that Orange County had already excluded all ZIP codes with fewer than five cases, regardless of population size, as did Alameda County for ZIP codes with fewer than 10 and Tulare for those with fewer than 11.)
CalMatters data viz reporter Lo Bénichou mapped the rate of overcrowding and virus cases in the major cities of Alameda, San Diego and Los Angeles counties. To make the maps more readable, neighborhoods with zero cases were excluded, as well as unincorporated areas and small, remote towns.
We then paired the neighborhood-level coronavirus data with demographics collected by the U.S. Census Bureau in the annual American Community Survey. We used data averaged from 2014 to 2018, which provides more reliable estimates for smaller neighborhoods. (Note that we did not analyze unincorporated parts of Los Angeles County because they did not correspond to geographic boundaries for Census data).
We used a commonly accepted definition of overcrowding: households with more people than rooms of all types, besides bathrooms.
The results were striking when we compared the 20% of neighborhoods with the highest rate of COVID-19 to the 20% of neighborhoods with the lowest rate:
- The hardest hit neighborhoods had three times the rate of overcrowding as the neighborhoods that have largely escaped the virus’s devastation.
- Those neighborhoods also had twice the rate of poverty.
- In the least affected neighborhoods, about half of residents are white, while in neighborhoods most heavily burdened by the virus, 82% of residents are people of color.
We also wanted to understand who lives in crowded housing in California. Using a definition of “essential workers” developed by the Public Policy Institute of California, CalMatters housing reporter Matt Levin crunched American Community Survey data from 2013 through 2017 via IPUMS USA, University of Minnesota. To get statistics on health insurance, he used survey data from just 2017. Here’s what he found:
- About one in six Californians — 6.3 million people — live in overcrowded houses or apartments that make it difficult to isolate from one another.
- About two-thirds of Californians in overcrowded homes are essential workers or live with at least one essential worker.
- Of those, 75% live in poverty, 92% are people of color and 12% lack health insurance.
This article is part of The California Divide, a collaboration among newsrooms examining income inequality and economic survival in California.


No Comments